subrela.plot.matplotlib.draw_node_marker function
-
subrela.plot.matplotlib.draw_node_marker(ax, node_data, orientation='vertical', kws=None)[source]¶ Draw markers of nodes.
- Parameters
ax (matplotlib.axes.Axes) – Subplot on which markers are drawn.
node_data (pandas.DataFrame) – Data of nodes returned by
subrela.plot.get_dendrogram_datafunction.orientation ({'vertical', 'horizontal'}, optional) – Orientation of a tree. If
'vertical', the height direction of a tree corresponds to the y axis. If'horizontal', it corresponds to the x axis.kws (dict or None, optional) – Keyword arguments passed to
matplotlib.axes.Axes.scattermethod.
- Returns
scatter (matplotlib.collections.PathCollection) – Markers.
Notes
The default value for
kws['marker']is'none'.Examples
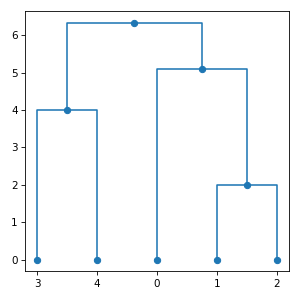
import numpy
import matplotlib.pyplot
from subrela.clustering import get_clusters
from subrela.plot import get_dendrogram_data
from subrela.plot.matplotlib import draw_dendrogram, draw_node_marker

X = numpy.array([[0, -5, -5, 6, 6], [0, -1, 1, -2, 2]])

Z = get_clusters(X)
leaf_data, node_data, tree_data, cut_data = get_dendrogram_data(Z)

_, ax = matplotlib.pyplot.subplots(figsize=(4, 4))
draw_dendrogram(ax, leaf_data, tree_data, cut_data)
draw_node_marker(ax, node_data, kws={'marker': 'o'})
matplotlib.pyplot.show()