subrela.plot.matplotlib.draw_trace function
-
subrela.plot.matplotlib.draw_trace(ax, trace_data, orientation='vertical', kws=None)[source]¶ Draw trace lines.
- Parameters
ax (matplotlib.axes.Axes) – Subplot on which trace lines are drawn.
trace_data (pandas.DataFrame) – Data of trace lines returned by
subrela.plot.get_trace_datafunction.orientation ({'vertical', 'horizontal'}, optional) – Orientation of a tree. If
'vertical', the height direction of a tree corresponds to the y axis. If'horizontal', it corresponds to the x axis.kws (dict or None, optional) – Keyword arguments passed to
matplotlib.axes.Axes.plotmethod.
- Returns
lines (list[matplotlib.lines.Line2D]) – Trace lines.
Notes
If neither key
'color'nor key'c'is inkws,'k'is set to'color'. If neither key'linewidth'nor key'lw'is inkws,2is set to'linewidth'.Examples
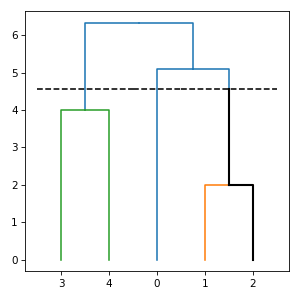
import numpy
import matplotlib.pyplot
from subrela.records import from_arrays
from subrela.clustering import get_clusters
from subrela.analysis import (get_strong_relevance_scores,
                              get_weak_relevance_scores)
from subrela.plot import get_dendrogram_data, get_trace_data
from subrela.plot.matplotlib import draw_dendrogram, draw_trace

scores = from_arrays([[False, False, False, True, True],
                      [True, False, False, True, True],
                      [False, True, False, True, True],
                      [True, True, False, True, True],
                      [False, False, True, True, True],
                      [True, False, True, True, True],
                      [False, True, True, True, True],
                      [True, True, True, True, True]],
                     [0.7, 0.7, 0.8, 0.8, 0.9, 0.9, 1., 1.])
X = numpy.array([[0, -5, -5, 6, 6], [0, -1, 1, -2, 2]])

Z = get_clusters(X)
leaf_data, node_data, tree_data, cut_data = get_dendrogram_data(
    Z, groups=[0, 5, 6])
srs = get_strong_relevance_scores(scores, Z, clusters=[5])
wrs = get_weak_relevance_scores(scores, Z, 5)
trace_data = get_trace_data(node_data, cut_data, wrs, tol=0.1)

_, ax = matplotlib.pyplot.subplots(figsize=(4, 4))
draw_dendrogram(ax, leaf_data, tree_data, cut_data)
draw_trace(ax, trace_data)
matplotlib.pyplot.show()